

Making Meaning from Data in Citrix Analytics
Citrix | UX Designer | 2018 - 2021
The challenge
Citrix Analytics is the go-to tool for security teams identifying and investigating potential threats.
The early versions of the product had:
Data chaos that turned search into a struggle for users.
Dashboards that displayed data without context or flow.
Reports were detailed but lacked actionable context to support decision-making.
My challenge was to design a system where admins could quickly uncover, interpret, and respond using critical signals.
What I did
Step 1: Supercharging Search
The original search was a bare text input. We conducted usability tests and discovered that:
80% users began with a dashboard alert like “excessive file download” and needed deeper investigation.
Filtering by IP, device, and location was non-negotiable.
Save, share, and repeat were key users did not have to rebuild searches.
My solution
Collaborated with engineers and content strategists to bring order to chaotic data.
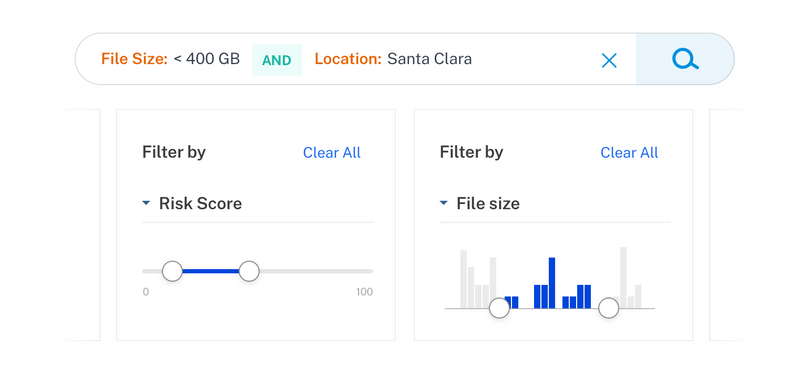
Built flexible, faceted filters (multi-select, ranges, dates, etc.) with reusable patterns integrated into the design library.
Embedded ML-driven search recommendations from dashboard events..
Introduced save, alerts, and share features to transform search into a reusable workflow.
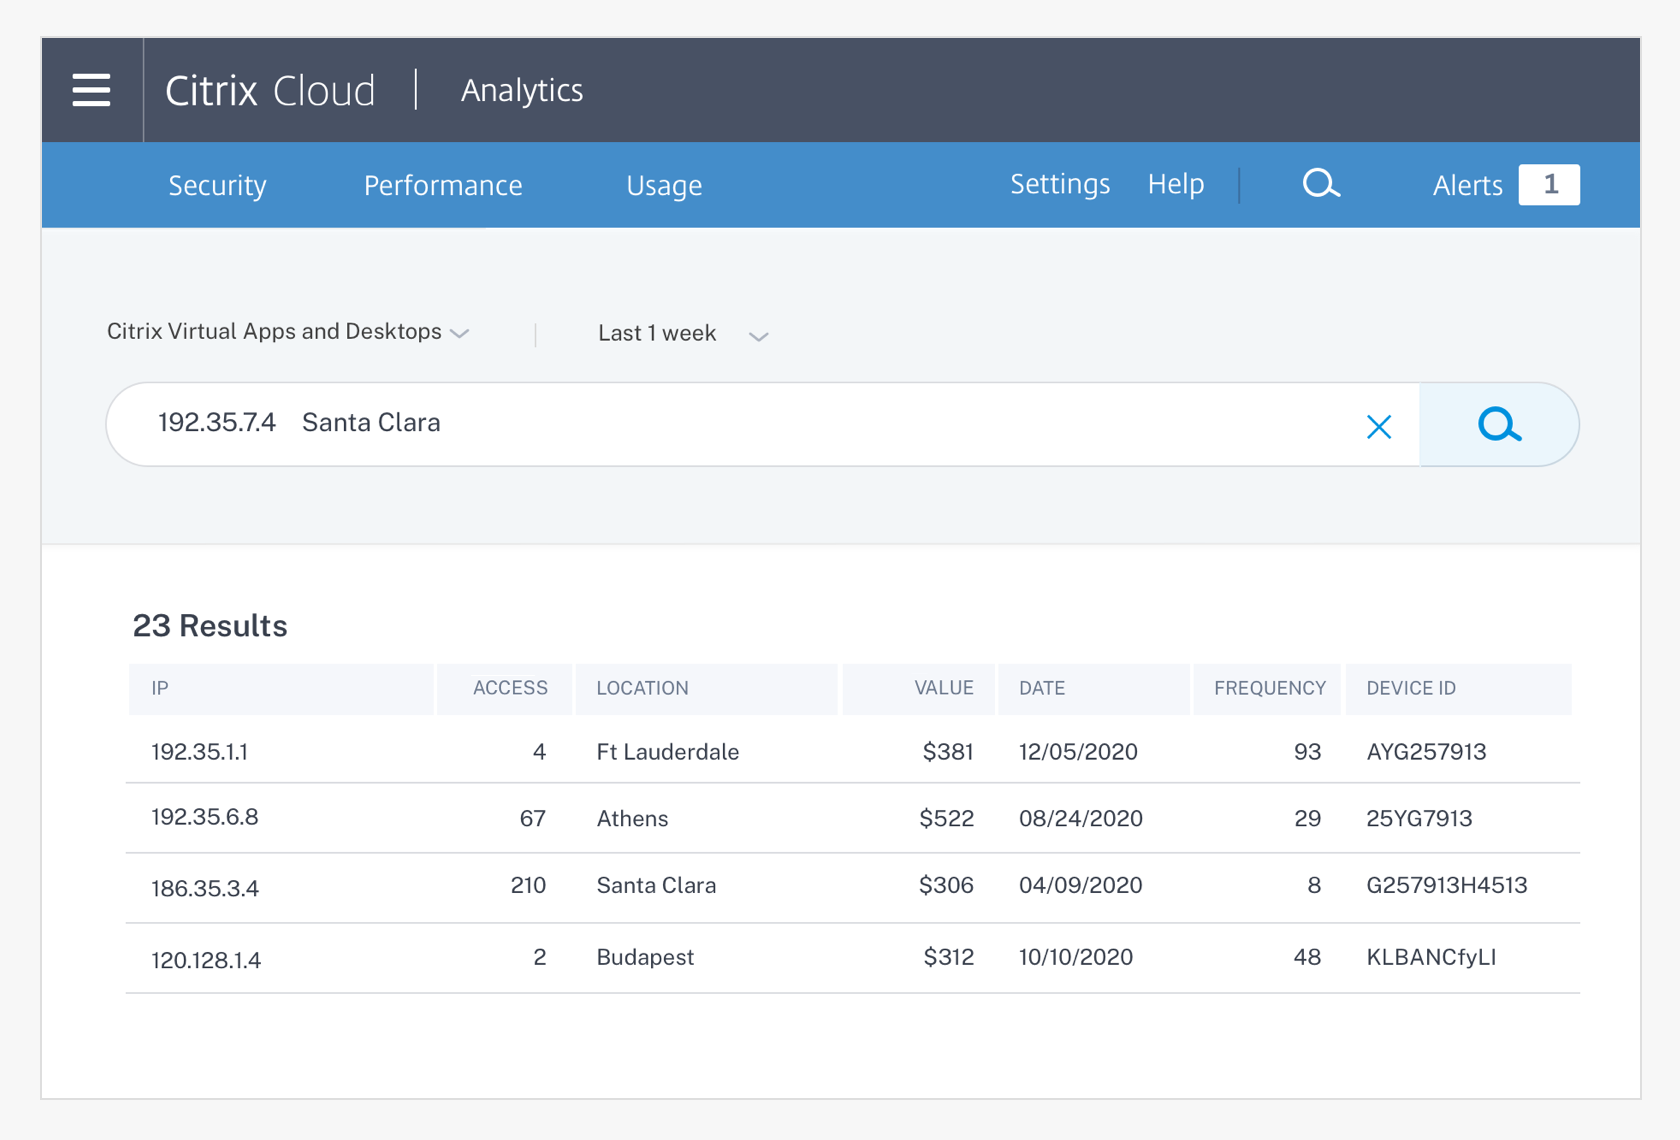
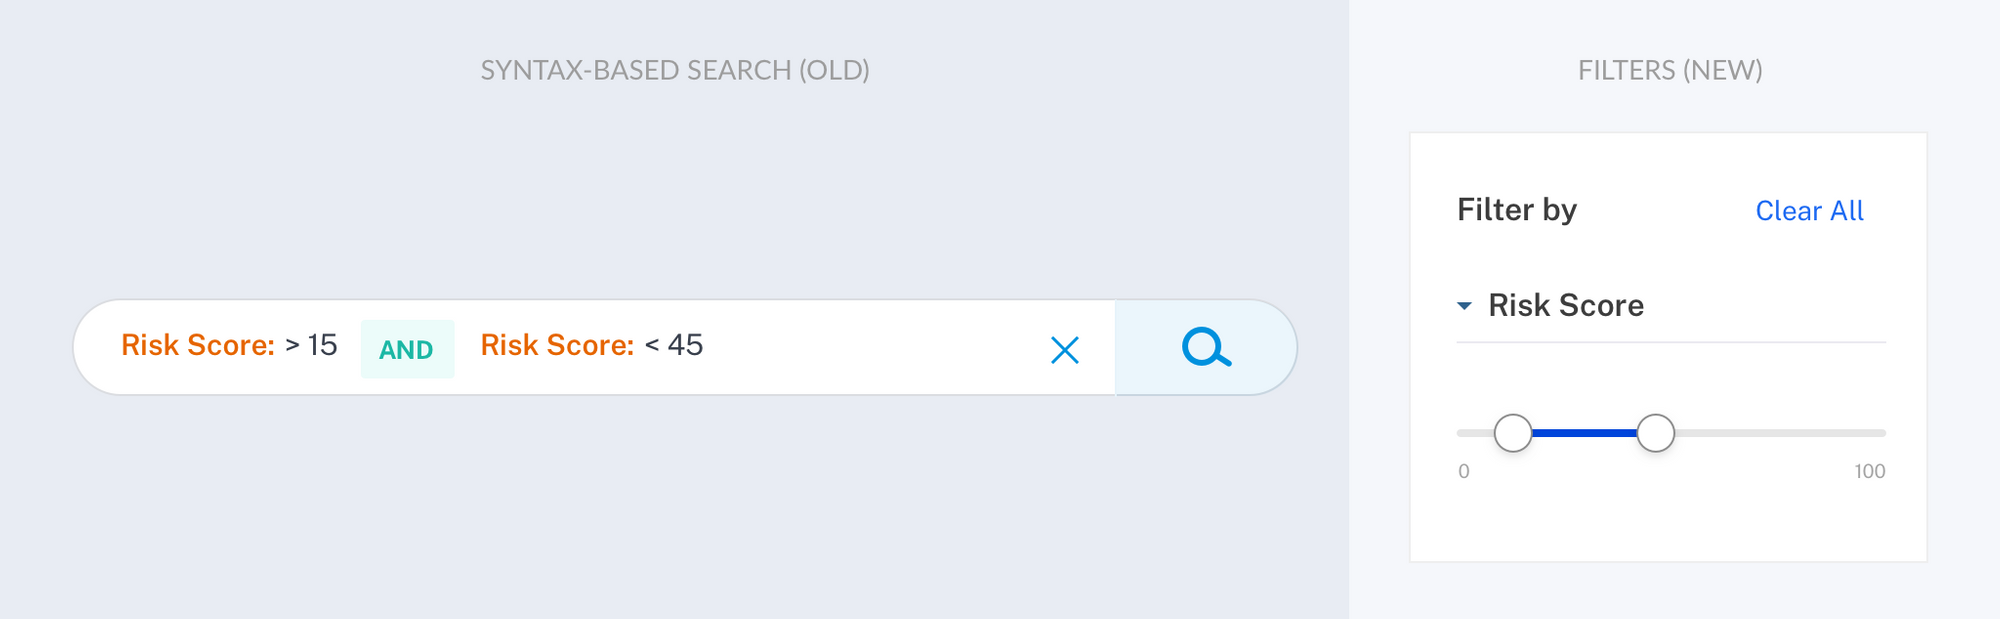
With the new data structure, we enabled accurate results by having users type structured search queries.
1. Each data point was tagged with a group and a value to enhance searchability.
2. Complex operators enabled users to target specific events.
“We wasted 10,000 hours on Facebook. Now we can see it.”

New design with a structured search entry
Once we had this key:value format search, I saw that most attributes would fall into one of four form field types:
1. Select multiple from a list

3. Numeric input for ranges

2. Select a single from a list

4. Simple selection for ranges
Shaping the design system
The filter designs served as building blocks for product layouts beyond Citrix Analytics. I documented clear guidelines and interaction specs for the components.

Leveraging Machine Learning
Search queries reveal user intent.
A significant advantage of Search is that it enables users to spell out their needs. By studying search logs, we extract data to help us optimize and deliver more relevant results to users.
I designed an “Explore events” panel to highlight activities tied to users’ organizational context. The system anticipates user needs and serves content before users submit specific queries.

Step 2: Storytelling with Dashboards
Raw, unstructured logs need context to inform and tell a story. Collaborating with PMs and clients, I created dashboards that:
Broke down WFH patterns to reflect active vs. idle, after-hours, and app usage.
Tracked and visualized logins geographically, enabling time scrubbers to help admins flag unusual patterns.

Key design highlights:
Geo views toggling between total, local, and activity.
Scrubbable timelines to highlight unusual spikes or drops.
Clean visuals linking data that showed events (what was going on) to impact (their real meaning).
“This type of analytics is one hundred percent perfect.”
Step 3: Reporting
After nailing search and dashboards, the next goal was to make insights shareable and repeatable across teams:
Designed reusable searches and scheduled reports so users could skip rebuilding complex queries.
Enabled real-time alerts for new activities tied to saved search criteria.
Designed column controls so admins could customize reports to fit their exact workflow.

Outcome & Impact

Elevated CAS to a reliable platform for enterprise security analytics. Shifted from raw log and text input to an integrated search, dashboard, and reporting system.

Extended impact beyond CAS. Reusable filters and charts were added to the company-wide design system, influencing Citrix’s broader design approach.

Reporting tied it all together, delivering insights that were easy to share, trigger alerts, and scale across teams.